July 11, 2026
Fractional jet ownership is a shared ownership model where multiple owners each purchase a percentage interest in a private aircraft (or aircraft category) and receive a fixed number of annual flight hours proportional to their share size. The question buyers ask most is easy to phrase and hard to answer cleanly: what does fractional jet ownership cost per year? For a realistic 2026 budget, treat fractional ownership as a three-part price (buy-in plus monthly fees plus occupied hourly rate) plus pass-through charges and contract-driven depreciation at exit.
This guide separates two numbers that competitors usually blur: your annual cash outlay (what leaves your account each year) and your annual economic cost (cash outlay plus the depreciation you absorb between buy-in and exit). Below you will find benchmark tables by share size and aircraft category, a plain worksheet you can reuse, and a checklist that ties contract fine print to real dollars. Pricing varies by provider, aircraft age, service area, contract terms, and market conditions, so these are benchmark ranges and a method to compare proposals, not quotes. Benchmarks reviewed: June 29, 2026.
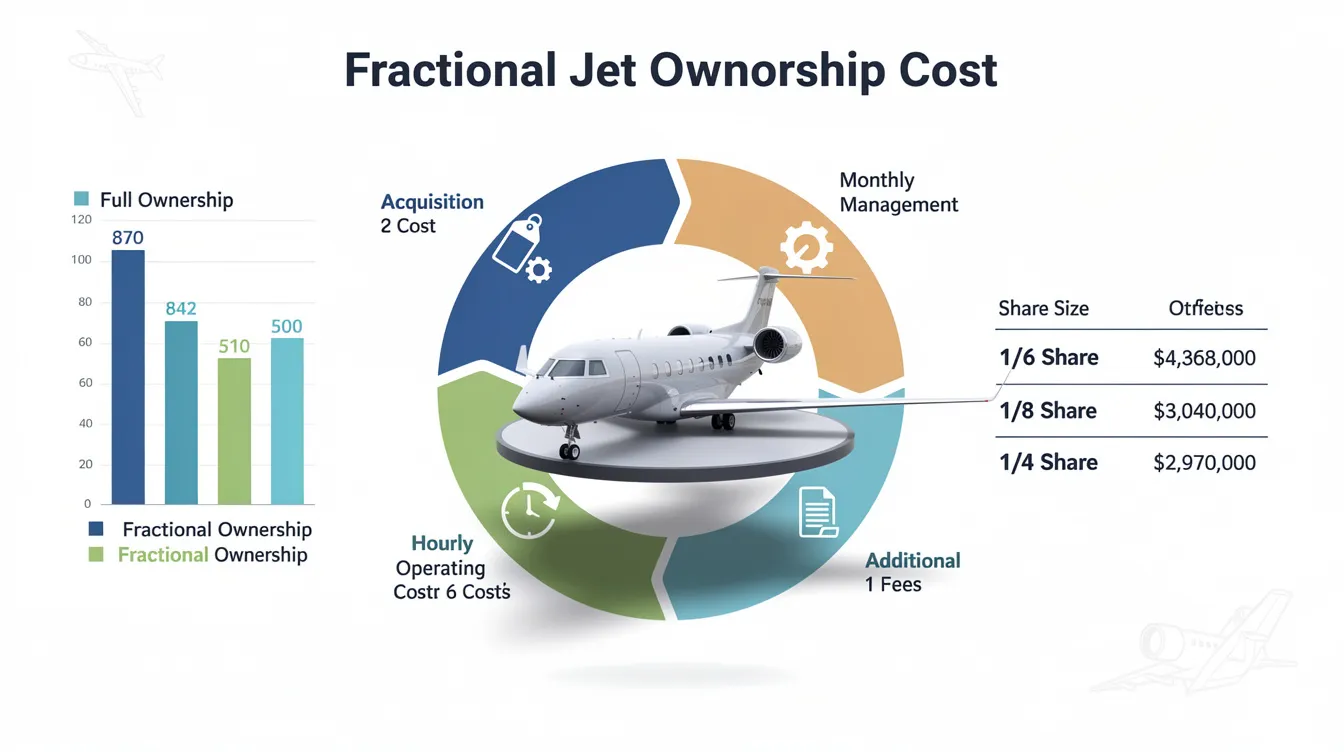
Fractional pricing has three core buckets: an upfront share acquisition cost (capital), fixed monthly management fees, and a variable occupied hourly rate billed only when you fly with passengers aboard. On top of those sit pass-through charges (de-icing, international fees, peak-day premiums, certain taxes) and the depreciation baked into your exit value. If a proposal shows only an hourly rate, it is incomplete.
The table below gives benchmark 2026 annual figures by aircraft category and share size. Each cell shows a typical cash outlay range (excluding the buy-in) and a typical economic cost range (cash plus annualized depreciation). These synthesize publicly stated ranges from provider pages and industry breakdowns, including Jettly's 2026 breakdown. Before the tables, it helps to review how fractional ownership works.
2026 annual cost ranges by aircraft category and share size (benchmarks) | |||
Aircraft category | 1/16 share (~50 hrs) | 1/8 share (~100 hrs) | 1/4 share (~200 hrs) |
|---|---|---|---|
Light | Cash $330K–$430K Econ $370K–$490K | Cash $620K–$800K Econ $700K–$900K | Cash $1.2M–$1.55M Econ $1.35M–$1.75M |
Midsize | Cash $480K–$620K Econ $540K–$700K | Cash $950K–$1.2M Econ $1.05M–$1.35M | Cash $1.85M–$2.25M Econ $2.05M–$2.5M |
Super-midsize | Cash $620K–$780K Econ $700K–$880K | Cash $1.2M–$1.55M Econ $1.35M–$1.75M | Cash $2.35M–$2.9M Econ $2.6M–$3.25M |
Large-cabin | Cash $920K–$1.15M Econ $1.03M–$1.3M | Cash $1.75M–$2.2M Econ $1.95M–$2.5M | Cash $3.5M–$4.1M Econ $3.9M–$4.6M |
Ultra-long-range | Cash $1.3M–$1.65M Econ $1.45M–$1.85M | Cash $2.4M–$3.0M Econ $2.7M–$3.4M | Cash $4.8M–$5.6M Econ $5.4M–$6.4M |
Benchmarks. Cash outlay excludes the upfront buy-in; economic cost adds annualized depreciation. See methodology near the end.
How much per year? Expect roughly $370K to $490K for a 1/16 light-jet share at about 50 hours, rising into the millions for a 1/4 large-cabin share at about 200 hours. What is included? Monthly management fees and your occupied hours; buy-in and pass-throughs sit outside those figures. What changes the number? Aircraft category, how many hours you actually fly, and how much of your buy-in you recover at exit.
Share size is the lever that sets both your capital and your hours. In most 2026 programs, 1/16, 1/8, and 1/4 shares correspond to about 50, 100, and 200 occupied hours per year, and the share size drives both your upfront capital and your ongoing fees. A 1/16 share is entry-level ownership with the lowest capital requirement. A 1/8 share is the balanced mid-level option. A 1/4 share is high-utilization ownership with a lower effective cost per hour and economics that start to resemble whole ownership.
Occupied hour is the billable flight time when passengers are aboard. In fractional programs it is typically billed only when you fly, though extra fees may still apply. Many programs deliver those hours through fleet interchange, meaning you receive a comparable aircraft within your category rather than one specific tail number. That improves availability at the cost of some cabin consistency. Access is governed by a guaranteed access window, often 8 to 24 hours of notice, which affects the value of a program as much as its price. Terms and definitions are worth checking against a fractional ownership glossary.
"Fractional ownership rewards buyers who accurately match their share size to their flying habits. Purchasing more hours than you'll realistically use can be just as expensive as buying too few and paying premium overage rates. The objective isn't maximizing hours purchased, it's optimizing cost per hour actually flown."
- Justin Crabbe, CEO
The tricky number is 75 hours. A 75-hour annual need typically sits between a 1/16 share (about 50 hours) and a 1/8 share (about 100 hours), so the real comparison is: buy the larger share and risk unused hours, or buy smaller and pay overage or premium rates, depending on the program's contract. Some providers structure hours in 25-hour increments; AirSprint's cost page shows 25, 50, 75, and 100-hour steps with a stated pricing-effective date, which is program-specific. Large operators like Jettly and BlackJet build around 1/16 and 1/8 blocks, and BlackJet's program page states shares begin at 1/16 (about 50 hours). Three contract details decide which 75-hour path is cheaper: the overage rate, whether unused hours roll over, and peak-day premiums.
Share size at a glance | ||||
Share | Typical annual hours | Best for | Primary cost risk | Typical term |
|---|---|---|---|---|
1/16 | ~50 | Entry-level, occasional flyers | Overage on hours 51+ | 3–5 years (varies) |
1/8 | ~100 | Regular business or family use | Unused prepaid hours | 3–5 years (varies) |
1/4 | ~200 | High utilization near whole ownership | Large capital lock-up | 3–5 years (varies) |
Standardizing the vocabulary is what makes two quotes comparable. A fractional quote is only comparable when you line up three numbers: the buy-in (capital), the monthly management fee (fixed), and the occupied hourly rate (variable), then add taxes and pass-through charges that may not be in the headline rate.
Upfront share acquisition cost: capital at risk, not a refundable deposit. Your recovery at exit follows a program formula.
Monthly management fees: crew, training, insurance, hangar, and administration, paid every month whether you fly or not.
Occupied hourly rate: fuel, routine maintenance, parts and engine reserves, and consumables, billed by the flown hour.
Commonly billed separately: de-icing, international landing, handling and overflight fees, peak-day or short-notice premiums, fuel surcharges, and certain taxes. A monthly management fee is a fixed charge covering the standing cost of keeping a fractional aircraft and crew ready to fly, whether you use your hours that month or not. That is why a lower hourly rate can still produce a higher annual total: if monthly fees and depreciation run high, the cheap-looking hour hides the real cost.
"The biggest misconception in fractional ownership is believing the occupied hourly rate tells you what you'll spend each year. It doesn't. Your real annual cost is the combination of your capital commitment, monthly management fees, flight activity, contract terms, and ultimately how much of your investment you recover when you exit the program."
- Justin Crabbe, CEO
Included versus billed separately, and where it appears | ||
Cost item | Usually included where | Where it shows up |
|---|---|---|
Crew, insurance, hangar, admin | Monthly management fee | Monthly invoice |
Fuel, maintenance reserves | Occupied hourly rate | Trip invoice |
De-icing, international handling | Pass-through | Trip invoice |
Peak-day / short-notice premium | Pass-through | Trip invoice |
Depreciation / exit shortfall | Capital economics | At exit |
Acquisition cost (buy-in) is the upfront price to purchase a fractional share. It is capital at risk, and your recovery at exit is typically set by a program resale formula rather than open-market pricing. Buy-in moves with aircraft category and share size, and two structural choices shift the number further: new versus pre-owned aircraft, and equity fractional versus managed-fleet programs. In 2026, the buy-in is the biggest driver of long-term fractional economics since depreciation and exit terms determine how much of that capital you actually recover.
Benchmark buy-in ranges, 2026 | |||
Category | 1/16 | 1/8 | 1/4 |
|---|---|---|---|
Light | $250K–$550K | $500K–$1.0M | $1.0M–$1.9M |
Midsize | $450K–$800K | $850K–$1.5M | $1.6M–$2.9M |
Super-midsize | $600K–$1.05M | $1.1M–$2.0M | $2.1M–$3.9M |
Large-cabin | $950K–$1.9M | $1.8M–$3.6M | $3.6M–$7.0M |
Ultra-long-range | $1.6M–$3.2M | $3.1M–$6.0M | $6.0M–$12M |
Benchmarks synthesized from publicly stated ranges and examples. Not real-time quotes.
To turn a buy-in into an annual figure for economic cost, spread expected depreciation across the contract term: (buy-in minus expected exit value) divided by years. A worked light-jet example from SherpaReport models a 1/16 Embraer Phenom 300 share against a roughly 50% depreciation assumption over a five-year term. Applied to a $400K buy-in, that implies about $200K recovered and near $40K of annualized depreciation, a line most brochures leave out. For a provider-specific reference, see these NetJets ownership costs.
Example benchmark, Phenom 300 1/16 share economics | |
Input | Benchmark |
|---|---|
Buy-in | ~$400K |
Contract term | 5 years |
Depreciation assumption | ~50% |
Estimated exit value | ~$200K |
Annualized depreciation | ~$40K/yr |
Monthly management fees are due even in a month you fly zero hours. They generally cover crew staffing and training, insurance, hangar, and program administration, the standing cost of readiness. Common exclusions are fuel, de-icing, peak-day premiums, international fees, and some taxes. Monthly management fees are the cost of readiness. If you fly less than expected, they are the main reason your effective cost per hour rises.
Most contracts carry a pricing escalator clause, a provision that raises monthly fees and hourly rates over time based on fuel, labor, training, insurance, or a scheduled annual percentage. Treat that as a budget line, not fine print, because it compounds across a three to five-year term. Major operators describe monthly management fees and occupied hourly rates as separate components; that structure appears on both BlackJet and Jettly pricing pages. For deeper detail, our guide to monthly management fees breaks down each line.
Benchmark monthly management fees per 1/16 share, 2026 | |||
Category | Monthly range | Annual total | Usually includes |
|---|---|---|---|
Light | $8.5K–$12K | $102K–$144K | Crew, insurance, hangar, admin |
Midsize | $11K–$15K | $132K–$180K | Crew, insurance, hangar, admin |
Super-midsize | $14K–$19K | $168K–$228K | Crew, insurance, hangar, admin |
Large-cabin | $19K–$27K | $228K–$324K | Crew, insurance, hangar, admin |
Ultra-long-range | $26K–$37K | $312K–$444K | Crew, insurance, hangar, admin |
Fees scale with share size: a 1/8 share pays roughly double these figures, a 1/4 share roughly quadruple. Fuel, de-icing, international fees, and certain taxes are excluded.
"Occupied" means billed when passengers are aboard, and it is not the same as "all-in." The occupied hourly rate is the variable fee charged for each hour you fly with passengers onboard; it typically covers fuel and maintenance reserves but may exclude taxes and certain trip-specific charges. Occupied hourly rates scale steeply by cabin class: light jets sit at the low end, midsize and super-midsize rise materially, and large-cabin and ultra-long-range carry the highest hourly costs.
Benchmark occupied hourly rates, 2026 | |||
Category | Seats / range | Occupied hourly range | Add-ons to confirm |
|---|---|---|---|
Light | 4–7, short-haul under 3 hrs | $3,000–$5,500 | Fuel surcharge, taxi time |
Midsize | 6–9, transcontinental | $5,500–$8,500 | De-icing, peak day |
Super-midsize | 8–10, coast-to-coast | $7,500–$11,000 | Peak day, international |
Large-cabin | 10–14+, intercontinental | $11,000–$18,000 | Overflight, handling |
Ultra-long-range | Global nonstop | $16,000–$25,000 | International, repositioning |
Add-ons ride on top of the base rate: fuel surcharges, de-icing, international fees, and peak-day premiums. Short trips carry a trap. Programs often apply a minimum billable flight time (frequently a one-hour minimum) plus taxi-time adders, which inflate the effective cost of a 40-minute hop. BlackJet notes taxi-time components in its billing structure. For a broader view of what these fees represent, see our primer on private jet operating cost. Entry buyers who fly short regional legs sometimes prefer turboprop fractional options such as the Pilatus PC-12 run by PlaneSense, which trade jet speed for lower hourly economics.
Two proposals with the same hourly rate can differ by six figures per year because of pass-through policies. The fastest way to underbudget fractional ownership is to ignore pass-throughs. De-icing, peak-day premiums, and international fees can add thousands per trip beyond the occupied hourly rate.
Pass-through charges are trip-specific costs billed in addition to the contracted hourly rate, such as de-icing, international handling, or airport and government fees, based on the flight's routing and conditions. One that surprises U.S. buyers is the Federal Excise Tax. The Federal Excise Tax is commonly cited at 7.5% on certain domestic flight charges, and Jettly's cost breakdown lists it alongside fuel surcharges, peak-day surcharges, and de-icing as items that sit outside a headline rate. On a $700K annual hourly spend, that Federal Excise Tax layer alone can approach $50K.
Peak days bring longer lead times, possible premiums, and usage caps during extreme demand, even though owners keep priority over charter clients. International flying adds handling and overflight charges. The right move is to ask direct questions before signing, which flows naturally into a full fractional ownership contract checklist.
Hidden cost checklist | |||
Item | When it applies | Billing method | Question to ask |
|---|---|---|---|
De-icing | Cold-weather departures | Per event, trip invoice | Is de-icing ever included? |
Federal Excise Tax | U.S. flights | Percentage on charges | Is FET shown on quotes? |
Peak days | Holidays, events | Premium plus lead time | How many peak days per year? |
International handling | Cross-border trips | Per trip pass-through | Does the hourly rate include handling? |
Fuel surcharge | Fuel-price moves | Per hour adder | How is the surcharge indexed? |
If you ignore exit value, your annual cost estimate is incomplete. Fractional ownership should be modeled as a service plus a depreciating asset: the buy-in affects your annual cost through the amount you do, or don't, recover at exit. Exit value is the amount you receive when you sell your fractional share back or transfer it under the program's contract formula, which may differ materially from what you paid.
Three brand-consistent realities shape this math. Contract terms often run three to five years, and exit eligibility can be limited to maturity, with early exits carrying penalties. Resale prices are usually set by a program-defined formula tied to depreciated value, not open-market pricing. Capital recovery can be delayed by resale queues and settlement timelines, so fractional ownership is not a liquid investment. Our deeper look at fractional depreciation and practical steps for how to sell a fractional share both set realistic expectations.
Convert all of this into one line. Annual economic cost is approximately (monthly fees × 12) plus (hourly rate × hours) plus pass-throughs plus (buy-in minus expected exit value) divided by years. The depreciation slice matters most at low hours, where it can rival your entire hourly spend.
Exit and depreciation sensitivity, $760K 1/8 light-jet buy-in over 5 years | |||
Scenario | Exit value | Annualized depreciation | Added cost per hour at 100 hrs |
|---|---|---|---|
Low depreciation (35%) | ~$494K | ~$53K | ~$530 |
Medium (50%) | ~$380K | ~$76K | ~$760 |
High (60%) | ~$304K | ~$91K | ~$910 |
Business buyers sometimes offset part of these costs through tax depreciation on the business-use portion of a share, and 2026 rules on bonus depreciation continue to evolve. Treatment depends on your facts, so confirm it with a qualified tax advisor rather than a sales desk.
Assumptions: the figures below are worked examples, not quotes. They use midpoint benchmarks from the tables above, a five-year term, and a 50% depreciation assumption. Effective cost per hour is total annual cost (including monthly fees and annualized depreciation) divided by the occupied hours you actually fly. At lower utilization, fixed monthly fees and depreciation dominate the math. At higher utilization, the occupied hourly rate becomes the main driver of annual cost. Compare these against our general breakdown of private jet costs.
Scenario A, 1/16 light jet, 50 hours. Monthly fees near $120K, occupied hours at 50 × $4,500 = $225K, roughly $25K in pass-throughs, giving about $370K cash outlay. Add $40K annualized depreciation for about $410K economic cost, or near $8,200 per hour flown.
Scenario B, 75 hours, the boundary case. Path one keeps a 1/16 share and buys 25 overage hours: about $120K fees, $225K base, $140K overage (at roughly 1.25×), $35K pass-throughs, near $520K cash and $560K economic, about $7,470 per hour. Path two takes a 1/8 share and flies only 75 of 100 hours: about $228K fees, $322K flown, $35K pass-throughs, near $585K cash and $662K economic, about $8,820 per hour. At exactly 75 hours, the smaller share plus overage wins on cost, but the larger share buys guaranteed access to 100 hours. This is the core fractional jet ownership cost 75 hours decision, and it hinges on overage pricing and rollover rules.
Scenario C, 1/8 midsize or super-midsize, 100 hours. Monthly fees near $300K, occupied 100 × $7,000 = $700K, about $60K pass-throughs, near $1.06M cash. Add $110K depreciation for about $1.17M economic cost, near $11,700 per hour flown.
Scenario D, 1/4 large-cabin, 200 hours. Monthly fees near $1.02M, occupied 200 × $14,000 = $2.8M, about $180K pass-throughs, near $4.0M cash. Add $462K depreciation for about $4.46M economic cost, near $22,300 per hour. At this utilization, the economics start to approach whole ownership.
Annual scenario summary (benchmarks) | ||||||
Hours/yr | Share | Category | Cash outlay | Annualized depreciation | Economic cost | Effective cost/hr |
|---|---|---|---|---|---|---|
50 | 1/16 | Light | ~$370K | ~$40K | ~$410K | ~$8,200 |
75 (path 1) | 1/16 + overage | Light | ~$520K | ~$40K | ~$560K | ~$7,470 |
75 (path 2) | 1/8 (fly 75) | Light | ~$585K | ~$76K | ~$662K | ~$8,820 |
100 | 1/8 | Midsize | ~$1.06M | ~$110K | ~$1.17M | ~$11,700 |
200 | 1/4 | Large-cabin | ~$4.0M | ~$462K | ~$4.46M | ~$22,300 |
Your result will differ by provider, service area, aircraft age, and contract terms. Use the worksheet below to run your own inputs.
There is no universally cheapest option; it depends on hours, predictability, and capital lock-up tolerance. A jet card is prepaid or subscription access to private aircraft at a fixed or semi-fixed hourly rate with no equity ownership and no resale risk. Charter is trip-by-trip booking priced on market demand, with no ownership commitment, covered in our private jet charter explainer. Whole ownership is buying 100% of an aircraft, with full control and full exposure to operating cost and depreciation.
Fractional is easiest to justify when you consistently fly enough hours to absorb fixed monthly fees. If your flying is infrequent or highly variable, jet cards or charter often produce a lower all-in annual cost. Magellan Jets and Jet Linx both frame the choice around annual hours and predictability. A growing pattern is the hybrid aviation portfolio: a fractional share for predictable lift, with a jet card or charter as backup for peak periods when access tightens.
Access model comparison, 2026 | |||||
Model | Upfront capital | Monthly fees | Cost predictability | Best for hours/yr | Primary downside |
|---|---|---|---|---|---|
Fractional | High | Yes | High | ~50–300 | Capital lock-up, depreciation |
Jet card | Prepaid deposit | No | High | ~10–50 | Rate increases, peak limits |
Charter | None | No | Low | Under ~25 | Price and availability swings |
Whole ownership | Highest | Yes | Medium | 300+ | Full operating responsibility |
The break-even logic follows the cost model: below the point where fixed monthly fees spread thinly across few flights, jet cards win; above it, fractional and eventually whole ownership take over.
A lower hourly rate is not a lower annual cost if contract terms add premiums or reduce availability when you need it most. Usage-mismatch risk is the cost risk of buying too large a share and underusing prepaid hours, or too small a share and paying premium overage rates or upgrading aircraft categories too often. Run every proposal through these items, then compare providers with our guide to compare fractional providers.
Notice window (guaranteed access, 8 to 24 hours)
Peak-day definition and annual peak-day count
Interchange rules, same type versus category
Overage rate above allocated hours
Rollover or borrow-ahead rules
Minimum billable flight time
Taxi-time adders
Fuel surcharge policy and indexing
De-icing policy
International fee policy
Escalation clauses on fees and rates
Contract term and renewal
Early-exit fees
Resale formula and settlement timing
Primary and extended service-area limits
Six questions to ask on your first call: What is my true occupied hourly rate with all standard surcharges included? How many peak days apply, and what is the premium? What is my overage rate, and do hours roll over? How is my exit value calculated, and when do I get paid? Which pass-throughs are never included? What escalators apply each year? Use this checklist to normalize proposals into apples-to-apples annual totals.
Use this worksheet to normalize proposals into the same annual cost format. Annual cash outlay is the money you pay during the year (monthly fees plus hourly charges plus pass-throughs), excluding the upfront share purchase. Annual economic cost adds annualized depreciation, meaning buy-in minus expected exit value divided by years. The simplest apples-to-apples comparison is annual economic cost: (monthly fees × 12) + (occupied hourly rate × hours) + pass-throughs + (buy-in minus exit value) ÷ contract years.
"The most effective way to compare fractional ownership proposals is to normalize every quote into the same financial model. Once acquisition cost, monthly management fees, occupied hourly rates, pass-through charges, and expected exit value are measured consistently, it becomes much easier to identify which program delivers the strongest long-term value."
- Justin Crabbe, CEO
Annual cost worksheet with three pre-filled examples | |||
Input | 50 hrs, light | 75 hrs, light/mid | 100 hrs, super-mid |
|---|---|---|---|
Share size | 1/16 | 1/16 + overage | 1/8 |
Monthly fee × 12 | $120K | $120K | $380K |
Occupied hourly × hours | $225K | $365K | $900K |
Pass-throughs | $25K | $35K | $80K |
Annual cash outlay | $370K | $520K | $1.36M |
Annualized depreciation | $40K | $40K | $140K |
Annual economic cost | $410K | $560K | $1.5M |
Effective cost/hour | $8,200 | $7,470 | $15,000 |
How to use it in six steps: (1) pick your share size and target hours; (2) drop in the monthly fee from the category table; (3) multiply your occupied rate by hours; (4) add a per-hour pass-through reserve; (5) subtract expected exit value from buy-in and divide by contract years; (6) divide the total by hours flown for your effective cost per hour. Suggested starting inputs come from the benchmark ranges above. Pick the right cabin first with our compare private jets guide.
In 2026, fractional jet ownership cost per year is typically the sum of buy-in economics (depreciation and exit), fixed monthly management fees, and variable occupied hourly charges, plus trip-specific pass-through items. Light-jet 1/16 shares run roughly $370K to $490K in economic cost, while large-cabin quarter shares reach several million. Ranges vary by aircraft category and provider, so use the TL;DR table and worksheet above.
Most fractional programs map 1/16, 1/8, and 1/4 shares to about 50, 100, and 200 occupied hours per year, though exact allocations and rules vary by contract. The share size also sets your upfront capital and monthly fees. Access typically runs on 8 to 24-hour notice windows with fleet interchange inside your aircraft category.
Monthly management fees generally cover standing costs like crew staffing and training, insurance, hangar, and program administration, paid whether or not you fly that month. Fuel, de-icing, peak-day premiums, international fees, and some taxes are usually billed separately. Most contracts also include escalation clauses that raise these fees over the term.
The occupied hourly rate is the variable fee charged for the time you fly with passengers onboard, and it typically reflects fuel and maintenance reserves, but it may exclude taxes and trip-specific pass-through charges. Watch for one-hour minimums and taxi-time adders that inflate short trips. See the hourly range table by category above for benchmarks.
Fractional ownership can be cheaper per hour at higher, consistent annual utilization, but jet cards can be cheaper all-in at lower hours since they typically avoid monthly management fees and capital lock-up. The crossover depends on how many hours you fly and how predictable that flying is. Run both through the worksheet before deciding.
If you exceed your allocated hours, you typically pay an overage rate (often higher than your contracted hourly rate) or switch to supplemental lift like a jet card or charter, depending on the program. Overage pricing is the deciding factor for buyers near a share boundary, such as the 75-hour case between a 1/16 and 1/8 share. Confirm the rate and any rollover rules in writing.
Selling a fractional share is usually contract-driven and can take time; your exit value is often set by a provider formula and may be delayed by resale processes. Recovery can fall below your original buy-in as aircraft values depreciate, and settlement follows the aircraft transfer. Treat fractional ownership as a service commitment, not a liquid asset.
Not necessarily; many fractional programs provide fleet interchange within the same aircraft type or performance class, so you may fly a comparable aircraft rather than a specific tail number. That improves availability, especially during busy periods, at the cost of some consistency in cabin configuration. Aircraft-specific shares offer more consistency; category-based shares offer better access.
FractionalJetOwnership.com is an independent educational and advisory resource, not a fractional program seller. We evaluate programs by structure over branding, issue no rankings or endorsements, and rely on no single source. Benchmark ranges here are synthesized from public program materials, industry disclosures, standard contract patterns, and market-level pricing, then cross-checked against the sources listed below. Figures are benchmarks, not real-time quotes or availability. Benchmarks reviewed: June 29, 2026. We do not provide individualized financial, legal, or tax advice, and this page does not replace provider disclosures or contracts.
The honest answer to "what does fractional jet ownership cost per year" is a formula, not a single number: buy-in economics plus monthly management fees plus occupied hourly charges plus pass-throughs, with depreciation deciding how much capital you recover. The best fractional deal is the one whose contract terms match your real travel profile, especially peak-day rules, overage pricing, and exit formula. Normalize every proposal into annual economic cost, and the right choice usually becomes obvious.
Run your own numbers with the worksheet above, then talk with our team for an independent, structure-first comparison of fractional programs. We do not provide individualized financial, legal, or tax advice and we do not represent real-time pricing; we help you compare program structures and the cost math so you can ask sharper questions. Reach us at info@fractionaljetownership.com or 1-866-321-JETS to get the worksheet and a side-by-side read on your proposals.
Jettly, Fractional Jet Ownership Cost Breakdown - benchmark 2026 acquisition, monthly fee, and hourly ranges plus pass-through and Federal Excise Tax references.
BlackJet, Fractional Ownership Program - shares from 1/16, occupied hourly rate structure, and taxi-time billing.
